MatplotlibChart
Displays a Matplotlib chart.
To display a Matplotlib figure with a built-in toolbar UI, use
MatplotlibChartWithToolbar.
Warning
This control requires the matplotlib
Python package to be installed.
See this installation guide for more information.
Inherits: GestureDetector
Properties
-
figure(Figure) –Matplotlib figure to draw - an instance of
Events
-
on_message(EventHandler[MatplotlibChartMessageEvent] | None) –The event is triggered on figure message update.
-
on_toolbar_buttons_update(EventHandler[MatplotlibChartToolbarButtonsUpdateEvent] | None) –Triggers when toolbar buttons status is updated.
Methods
-
back–Goes back to the previous view.
-
download–Downloads the current figure in the specified format.
-
forward–Goes forward to the next view.
-
home–Resets the view to the original state.
-
pan–Activates the pan tool.
-
send_binary–Sends a binary message to the front end.
-
send_json–Sends a JSON message to the front end.
-
send_message–Sends a message to the figure's canvas manager.
-
zoom–Activates the zoom tool.
Examples#
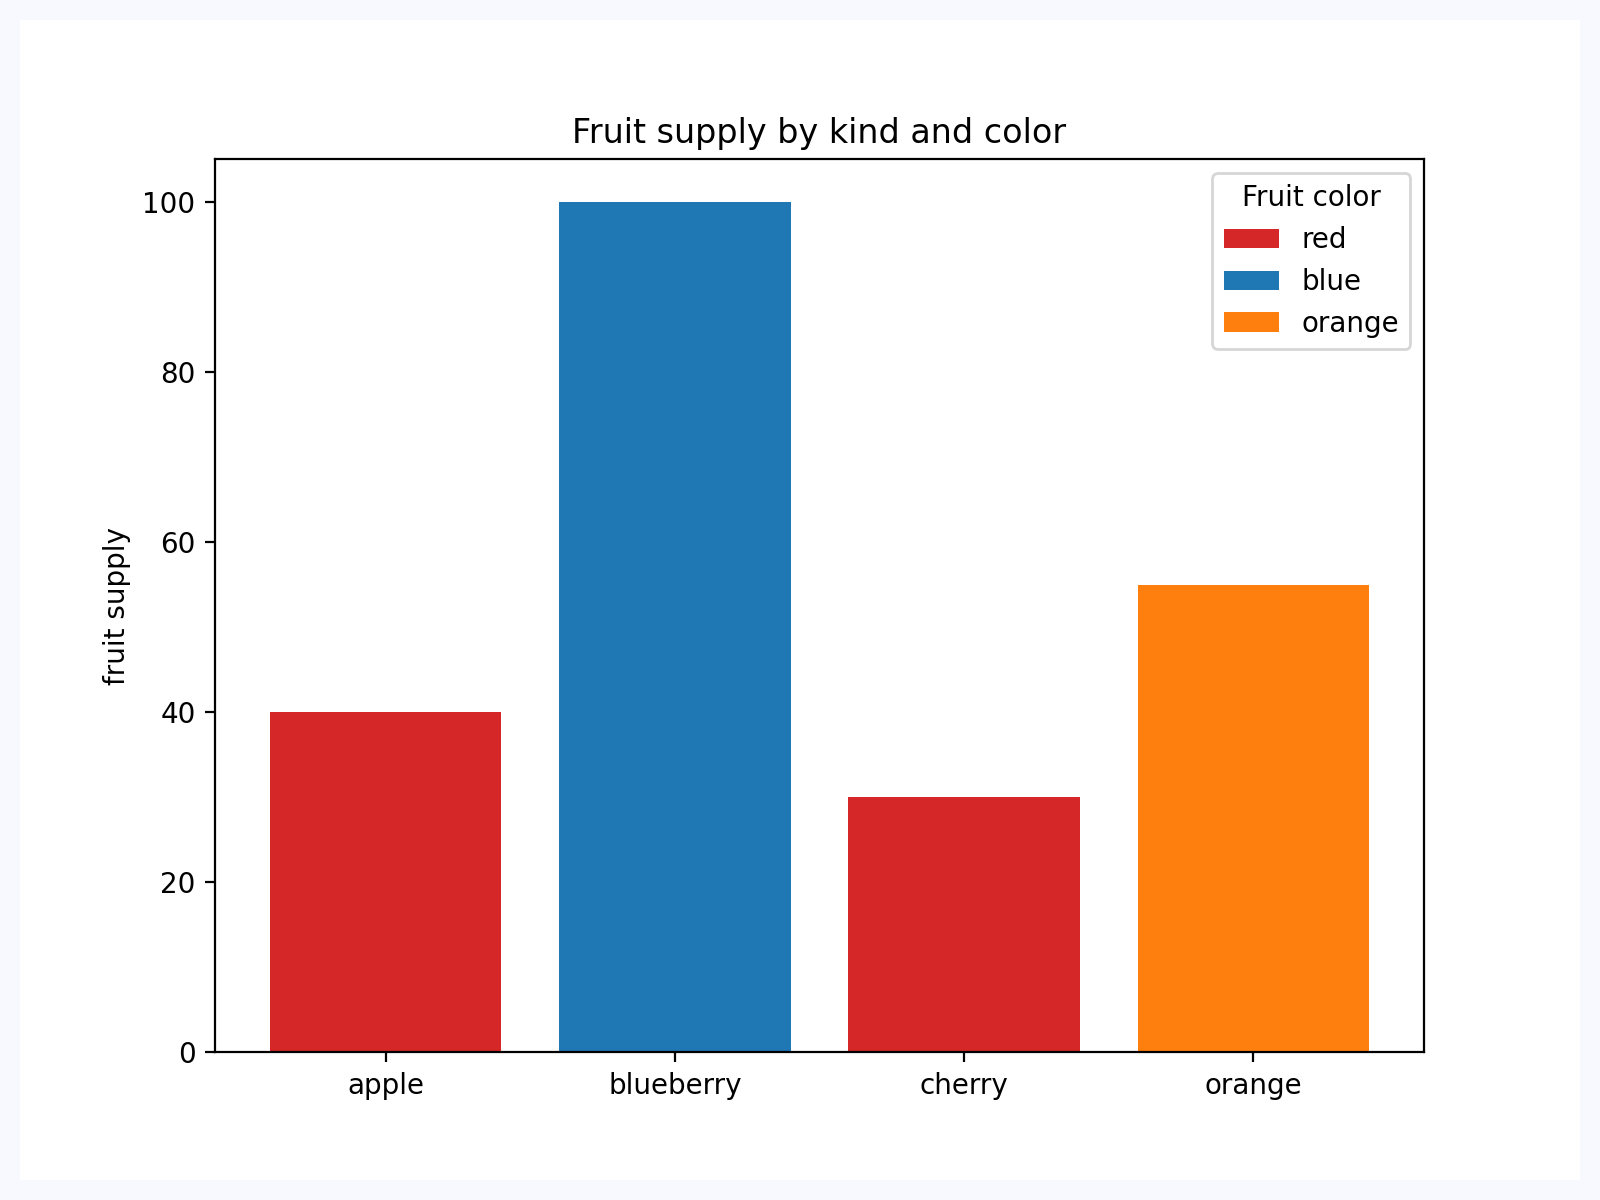
Bar chart#
Based on an official Matplotlib example.
import matplotlib.pyplot as plt

import flet as ft
import flet_charts as fch


def main(page: ft.Page):
    fig, ax = plt.subplots()

    fruits = ["apple", "blueberry", "cherry", "orange"]
    counts = [40, 100, 30, 55]
    bar_labels = ["red", "blue", "_red", "orange"]
    bar_colors = ["tab:red", "tab:blue", "tab:red", "tab:orange"]

    ax.bar(fruits, counts, label=bar_labels, color=bar_colors)

    ax.set_ylabel("fruit supply")
    ax.set_title("Fruit supply by kind and color")
    ax.legend(title="Fruit color")

    page.add(fch.MatplotlibChart(figure=fig, expand=True))


if __name__ == "__main__":
    ft.run(main)
Properties#
class-attribute
instance-attribute
#
figure: Figure = field(metadata={'skip': True})
Matplotlib figure to draw - an instance of
matplotlib.figure.Figure.
Events#
class-attribute
instance-attribute
#
on_message: (
    EventHandler[MatplotlibChartMessageEvent] | None
) = None
The event is triggered on figure message update.
class-attribute
instance-attribute
#
on_toolbar_buttons_update: (
    EventHandler[MatplotlibChartToolbarButtonsUpdateEvent]
    | None
) = None
Triggers when toolbar buttons status is updated.